Note
Access to this page requires authorization. You can try signing in or changing directories.
Access to this page requires authorization. You can try changing directories.
In this article, you learn how to take advantage of the latest iteration of metrics available to monitor your Azure VMware Solution private cloud.
Azure VMware Solution provides users with an array of high-level health and performance metrics to provide visibility into the health and performance of an Azure VMware Solution private cloud. In 2024, a set of identical metrics labeled as "new" were introduced. The "new" metrics, which include a series of enhancements to the stability, reliability, and performance of those metrics were made to provide users a better experience relative to the older set of metrics.
View Azure VMware Solution metrics
From your Azure VMware Solution private cloud, select Metrics under the Monitoring section. Then under the Metric dropdown, choose a metric that contains the word "(new)". These newer metrics are powered by our improved metrics engine, providing utmost reliability and stability. The metrics monitor items like memory consumption, datastore usage, and CPU across your Azure VMware Solution private cloud.
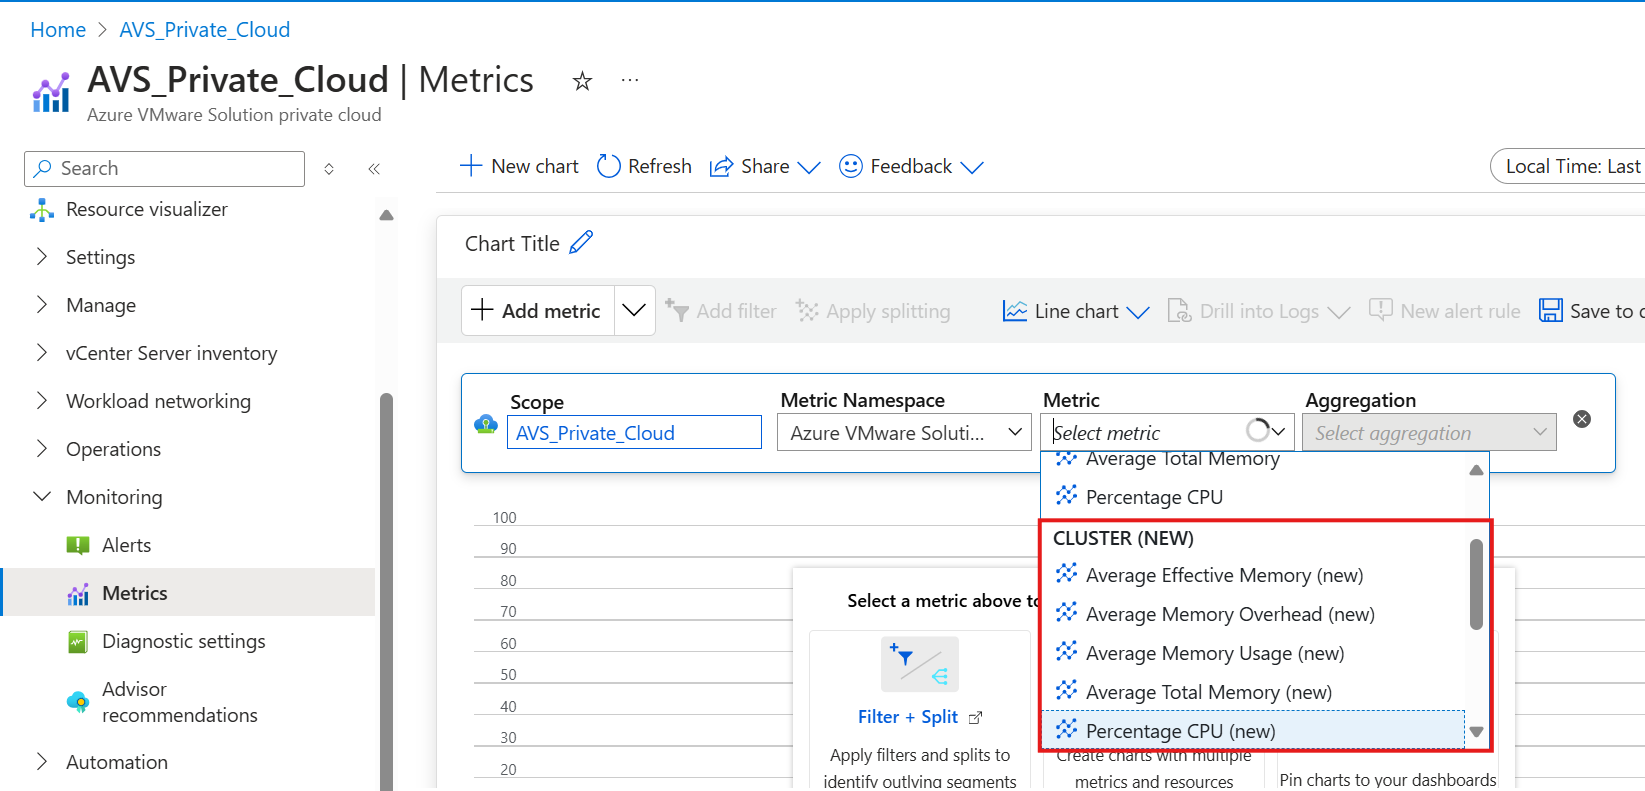
Setting up a chart
Select a metric you'd like to build a chart for, such as "Percentage CPU (new)" in this example. Upon doing so, you see a chart, like the following example, that shows a time series for the metric selected.

You can toggle the time window you're interested in for this metric by selecting the time window button in the top-right corner. The default window for your selected metric is 24 hours.
Once you're ready to save, select Save to Dashboard, then select one of the options presented for where the metric lives.
Send metrics to other monitoring solutions using the new metrics
Additionally, you can hover over each metric in the Metric dropdown to see the Metric identifier (ID). You can use this Metric ID in your third-party monitoring tools to monitor your Azure VMware Solution private cloud.
Important
We strongly encourage all users - first time and repeat - to migrate to the new metrics suffixed with "(new)".
Several customers previously used the metrics to build monitoring in downstream tools and configurations that rely on the old metric IDs. The following table provides corresponding, newer metric IDs you can use for the same set of metrics to seamlessly transition to using the newer set of metrics:
| Metric Name (as viewed in the portal) | Current Metric ID | New Metric ID |
|---|---|---|
| Datastore Disk Used | UsedLatest | DiskUsedLatest |
| Datastore Disk Total Capacity | CapacityLatest | CapacityLatest |
| Average Effective Memory | EffectiveMemAverage | ClusterSummaryEffectiveMemory |
| Average Total Memory | TotalMbAverage | ClusterSummaryTotalMemCapacityMB |
| Average Memory Overhead | OverheadAverage | MemOverheadAverage |
| Average Memory Usage | UsageAverage | MemUsageAverage |
| Percentage CPU | EffectiveCpuAverage | CpuUsageAverage |
| Percentage Datastore Disk Used | DiskUsedPercentage | DiskUsedPercentage |